
Infographics have skyrocketed to web fame, becoming one of the premier vehicles for conveying information in an engaging way.

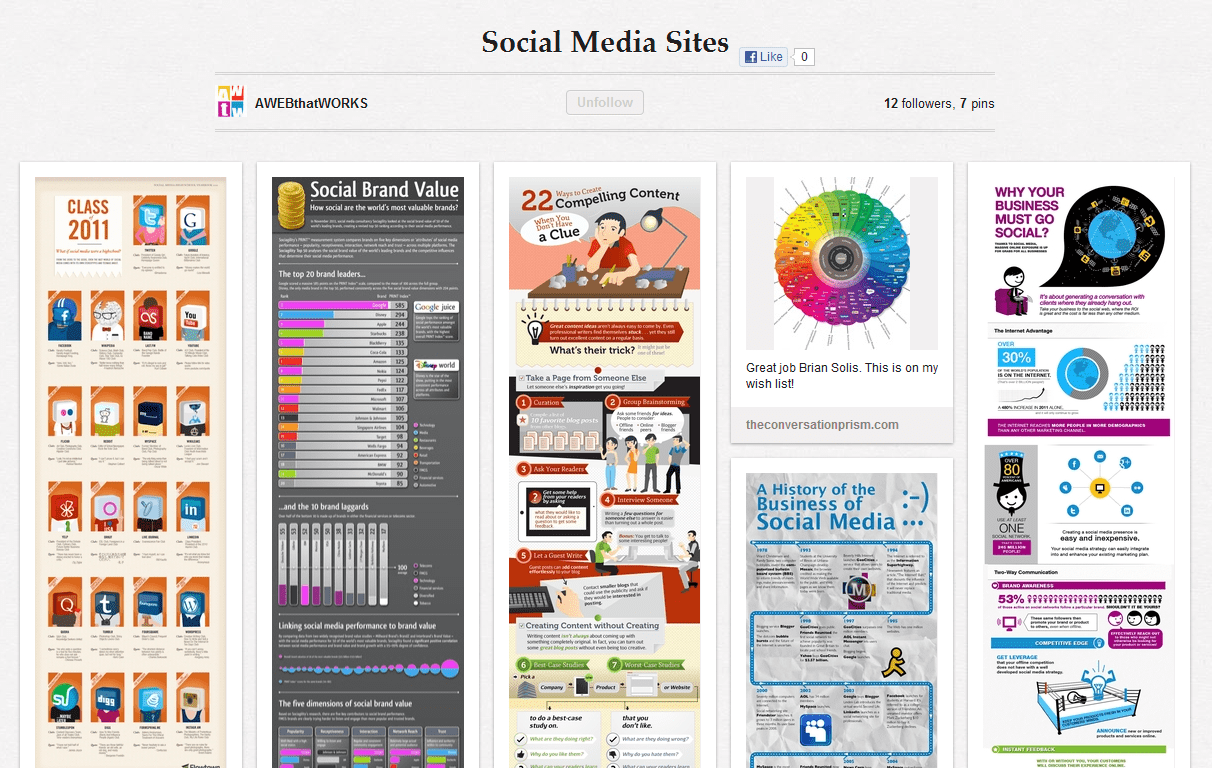
- Click to check out AWTW’s Pinterest-ing collection of social media infographics.
Why people love infographics:
- easy to read = low time investment, high content yield
- aesthetically appealing
- satisfy cravings for numbers and statistics
Ready to make your own? Here are some important points to consider:
- how will you balance design and information?
- where will you get your stats?
- have you picked an issue that is popular/timely enough?
- have you focused on the content (not shameless self-promotion)?
While infographics are widely loved, nothing is more frustrating than a hard-to-read or confusing infographic. Striking a balance between design and information (or making the decision that one outweighs the other) is crucial. A visually dynamic layout may not support complex content, and vice-versa.
Timely relevance = viral content. Creating an infographic on the politics of social media is relevant. Releasing that infographic 2 weeks before election day is timely. Don’t be afraid to hitch a ride on current events.
As tempting as it may be to throw in brand specials, logos and calls-to-action, infographics are about adding value for your audience. Branded content tends to turn off readers of infographics, so savvy brands rely on the strength of their content, rather than the prevalence of their logo.